Musings of a dad with too much time on his hands and not enough to do. Wait. Reverse that.

Author: Brad (Page 42 of 57)

Dad. Technologist. Fan of English poet of John Lillison.

Annotating the War on Poverty

The other day, I was listening to the Contra Krugman episode entitled “How to Unwind the Welfare State”. Toward the end of the discussion, the hosts began listing examples of private organizations in the free market solving social problems only to be stymied when the federal government began to insert itself into the situation. Host Bob Murphy referenced an article he wrote for FEE where he discussed how, in the 1950s and 60s, the free market was already lifting people out of poverty at a pretty good clip just to have Lyndon Johnson and the federal government jump on the bandwagon halfway through and claim that it was their legislation, not the free market, that did all the heavy lifting.

I couldn’t find the article Bob was referencing (maybe it was this?); nevertheless, it occurred to me this might be an opportunity to improve my matplotlib skills. Maybe I could find the official US poverty numbers, plot them out, then annotate the plot with markers indicating when key legislation in the War on Poverty was enacted. Would this convey the point Bob was making?  Here are highlights of what I did (the full code is available on my Github page):

Step 1: Get the data

Is it me or is it just confusing downloading the data you want from the US government?  The US Census Bureau publishes the poverty numbers, but I found it very confusing which numbers I needed and for the time period in which I needed it.  I finally found a dataset I could use on the page, Historical Poverty Tables: People and Families – 1959 to 2016.

Step 2: Load the data

Here’s a snippet of the spreadsheet I downloaded:

Makes sense, I guess, but it took me a while to figure out an optimal way to load the spreadsheet into a dataframe with Pandas.  In the end, though, it only took two lines of code:


1
2
df_pov = pd.read_excel('./hstpov9.xls', header=[3,4,5], index_col=0)
df_pov = df_pov[:-1]  # drop the last row as it's just a footnote

Step 3: Get some legislation dates

Wikipedia to the rescue!  Wikipedia called out four major pieces of legislation in the War on Poverty:

  • The Economic Opportunity Act of 1964 – August 20, 1964
  • Food Stamp Act of 1964 – August 31, 1964
  • Elementary and Secondary Education Act – April 11, 1965
  • Social Security Act 1965 (Created Medicare and Medicaid) – July 19, 1965

Step 4: Plot time?  Not so fast!

So, the major pieces of legislation happened in 1964 and 1965.  Now, I can plot the poverty rate from the dataset I have and then add annotations at years 1964 and 1965.  Er, wait a minute…the dataset is missing the poverty rate from those years!  In fact, it’s missing all the years between 1960 and 1969.  Weird!  How will I know, on the plot, where to place my annotations?  Well, Pandas can figure that out with its handy interpolate function!  Only two lines of code to do the calculation!


1
2
3
4
5
# create a dataframe for the data I'm missing
df_gap_data = df_pov.loc[[1960, 1969], ('Total', 'Below poverty')]
# create rows for the missing data and use Pandas interpolate to make a best guess at what the poverty rate was during
# those missing years
df_gap_data = df_gap_data.reindex(pd.RangeIndex(df_gap_data.index.min(), df_gap_data.index.max() + 1)).interpolate()

Step 5: Now, plot time!

Now that I know where to place my annotations, here’s what I came up with for the plot:


1
2
3
4
5
6
7
8
9
10
11
12
13
14
15
16
17
18
19
20
21
22
23
24
25
laws = [('Education Act', 1965), ('Social Security Act', 1965),
        ('Economic Opportunity Act', 1964), ('Food Stamp Act', 1964)]
title = 'Total Below Poverty Percentage, United States, with annotations'
y_offset = 0  # offset counter for the text block annotations

# plot the poverty rate
ax = df_pov.sort_index().loc[:, ('Total', 'Below poverty', 'Percent')].plot(title=title, figsize=(12, 10))
ax.set_xlabel('Year')
ax.set_ylabel('Percent below poverty')

# loop through the legislation so I can add those annotations
for law in laws:
    y_offset += 30
    name, year = law
    percent = df_gap_data.loc[year, 'Percent']
    ci = Ellipse((year, percent), width=0.5, height=0.1, color='black', zorder=5)
    ax.add_patch(ci)

    ax.annotate(name,
                xy=(year, percent), xycoords='data',
                xytext=(175, 300 + y_offset), textcoords='axes points',
                size=20,
                bbox=dict(boxstyle="round", fc="0.8"),
                arrowprops=dict(arrowstyle="->", color='black', patchB=ci,
                                connectionstyle="angle3,angleA=0,angleB=-90"))


And that rendered the plot at the top of this post.  Does that chart illustrate the point Bob Murphy was trying to make in the podcast?  I think so, but take a listen for yourself and let me know.  The big takeaway is all the cool annotations you can do in matplotlib.

OCRing images in Windows

I recently visited a facility that displayed framed “wall art” of funny quotes from famous people. I found the quotes amusing, so I took pictures of all the wall hangings. The problem is, I don’t want to spend the time typing up all those quotes by hand (of course, I’ve probably spent much more time programming an alternative).  Anyway, OCR to the rescue!

Windows seems to have a variety of options for OCR, but these all seem largely GUI driven.  I’d rather have a command line solution.  Enter Tesseract-OCR.

Tesseract is a command line tool used for parsing text from image files.  Like most cool tools of its ilk, it works best in Linux.  Am I sunk, then, as my main environment is Windows?  Nope.  I can install tesseract in my Linux sub-system and access it from Windows.  Here’s how I solved this problem:

Step 1: Use wsl.exe to run tesseract

I actually ran all my work from a Jupyter Notebook using its shell command feature.


1
2
image_file = '/mnt/c/myfilepath/nb-miscellany/IMG_20180801_150228139.jpg'
! wsl tesseract {image_file} {image_file}

Step 2: Open the results

Tesseract seems to automatically append a “.txt” to the end of the outfile you supply it.  Since I supplied it my image filepath, it created a new file, IMG_20180801_150228139.jpg.txt, containing the text it parsed.  I can just run “cat” to see the results:


1
2
3
out_file = image_file + '.txt'

! wsl cat {out_file}

And here are my results:

Everyone needs to believe in something. I believe I'll
have another drink.

W.C. Fields

The only reason people get lost in thought is because
it's unfamiliar territory.

Unknown

I want a man who's kind and understanding. Is that
too much to ask of a millionaire?
Zsa Zsa Gabor

By the time a man is wise enough To watch his step,
he's too old to go anywhere.
Billy Crystal

There are two Types of people in +his world, good and
bad. The good sleep better, but the bad seem To
enjoy the waking hours much more.

Woody Allen

r never forget o face, but in your case I'll be glad to
make an exception.
Groucho Marx

The secret of staying young is to live honestly, eat
slowly and lie about your age.
Lucille Ball

Not too shabby!

Run Linux apps in Windows

Windows 10 now includes the ability to run a Linux shell within it.  That alone is pretty awesome.  What’s even awesome…er…is that you can easily access that sub-system from Windows with the wsl.exe utility.  Try this out:

Step 1: Launch your Linux subsystem

On my Windows laptop, I installed an instance of Ubuntu.  From my home directory, I simply list the directory contents:


1
2
3
4
5
6
7
8
9
brad@brad-laptop:~$ ll
total 8
drwxr-xr-x 1 brad brad 4096 Aug 26 13:57 ./
drwxr-xr-x 1 root root 4096 Aug 25 21:08 ../
-rw-r--r-- 1 brad brad  220 Aug 25 21:08 .bash_logout
-rw-r--r-- 1 brad brad 3771 Aug 25 21:08 .bashrc
-rw-r--r-- 1 brad brad  807 Aug 25 21:08 .profile
-rw-r--r-- 1 brad brad    0 Aug 25 21:11 .sudo_as_admin_successful
-rw-rw-rw- 1 brad brad    0 Aug 26 11:04 test.txt

Step 2: Open up the Windows command shell

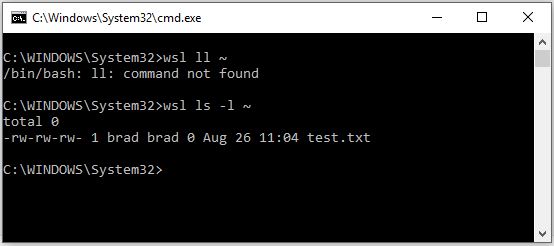
Now, open up a Windows command shell.  Using wsl.exe, list the contents of your home directory.  Interestingly, while my Ubuntu instance knows the “ll” alias, wsl does not.  Nevertheless, I can run the ls -l command and see the contents of my home directory.

What if you have multiple Linux sub-systems installed?

Initially, I installed multiple Linux sub-systems on my Windows machine, but could find no way to get wsl to target a specific system.  There may well be an option: I just haven’t been able to find it yet.  Regardless, this advent from Microsoft now opens up so many more options, as there are a variety of wonderful tools in Linux that either can’t be installed in Windows or can’t easily be installed.  Now, you don’t have to: just install those tools in your Linux sub-system and run them there or from Windows via wsl.exe.

« Older posts Newer posts »

© 2025 DadOverflow.com

Theme by Anders NorenUp ↑